Laboratory Products
Comparing the energy and temperature performance of laboratory fridges
Mar 10 2020
Author: Andy Evans on behalf of Scientific Laboratory Supplies Ltd
Fridges are widespread throughout scientific research and teaching. They are found in molecular sciences, life sciences, chemistry and stores departments throughout the UK. With UK labs aiming to minimise their running costs, highlighting the fridge with the lowest running costs is a useful exercise.
However, energy consumption values alone would not be serving end user requirements. This study aimed to highlight some of the data and criteria which should be considered when selecting the most sustainable solution based on the specific needs of the researcher, their laboratory and the materials they are storing.
Storing at 4ºC
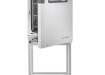
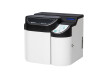
Typically, fridges are used to store their contents at the set point of 4ºC. Scientific Laboratory Supplies Ltd (SLS) commissioned this study to investigate the differences in performance between three well known brands of under bench fridges which they supply to the UK market. The three units were selected based on having similar capacities, refrigerant type and volume and having spark reduced or spark free interiors. The three units (Figure 1) were tested under controlled conditions at the Healthcare Technologies Institute, University of Birmingham. The three units were monitored at the 4ºC set point, with their temperature performance, energy consumption and door opening recovery Mmes recorded. It must be noted that the Biocold unit did not have a digital temperature controller, instead a simple dial was fixed on the back of the unit marked from 1 to 10, and these numbers do not represent a temperature. Therefore the dial was set to a point between 4 and 5 which brought the sample temperature probe to ~4ºC.
Measuring temperature and energy
This case study used the Koolzone energy monitors, temperature probes and online platform to record all the data. One difference that must be highlighted in terms of monitoring is the pull down time.
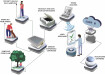
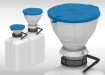
Traditionally, the pull down time is measured by placing one probe inside the unit and measuring the time taken for the probe to reach the average chamber temperature. This study employed a more representative method. Whereby the pull down time is defined as the time taken for each compartment/section to reach its average temperature (accurate to 0.1ºC) measured at the 4ºC set point with no door openings over a 24 hour period. Please note that the Lec and Biocold unit had three more temperature probes as they have storage sections located on their doors (Figure 2).
The data collected for each unit concerning pull down time, temperature performance and energy consumption without door openings is shown in Table 1. The compartments are numbered in descending order with the top compartment being named compartment 1. The sample probe was placed in the centre most compartment of each unit. This compartment, along with the sample probe is highlighted in light blue in both Tables 1 and 2.
Each unit was then subjected to 2 timed door openings. The first door opening was for a duration of 60 seconds. It was estimated that 2 hours and 45 minutes would be long enough for temperatures to fully recover from the 60 second door opening. Following this time a second, longer door opening was carried out, this time for a duration of 90 seconds. The recovery time was measured as the time taken for the temperature to recover to the exact temperature it was at the time of the door opening, accurate to 0.1ºC. The results of the timed door openings are shown in Figure 4.
Conclusion
When considering the pull down times the Liebherr unit was fastest with all compartments reaching their average temperature within 83 minutes. With the Lec unit this figure is 90 minutes, (compartments only), 107 minutes if the door compartments are included. The Biocold model required 6 hours and 8 minutes to for its compartments to pull down to their average temperature, during this time its door sections all reached their average set point temperatures. When looking at compartment air temperatures only the Liebherr unit was the coldest at 2.0ºC, the Lec followed at 3.0ºC and the Biocold unit was significantly warmer at 5.5ºC. It must also be noted that the automatic defrost cycle was responsible for the highest temperatures observed in the Liebherr unit, including temperatures measured following the timed door openings (Figure 3).
The recorded sample temperatures were coldest in the Lec unit, with the Liebherr sample being 1.1ºC warmer. The sample temperature in the Biocold unit was 4.1ºC.
Door opening data indicated that when looking at the compartment air temperatures the Liebherr unit had the fastest recovery times. It was also noted that the recorded temperature rises were the smallest in the Liebherr unit (under 1ºC following a 60 second door opening). The Lec unit took approximately twice the time to recover its compartment temperatures compared to the Liebherr unit with the Biocold taking over 4 times longer to recover its compartment temperatures. Furthermore it must be noted that the Biocold was also recovering to warmer temperatures compared to those in the Lec and Liebherr models.
The door opening data may also be linked to energy consumption. The Liebherr unit, with an energy consumption of 1.009 kWh/day had the faster pull down times and door opening recovery times. The colder recorded air temperatures and use of a fan would require greater energy consumption compared to units without a fan and with warmer temperatures. The Lec and Biocold units had similar energy consumptions, however, the standardised energy consumption (watts per litre per day) of the Lec unit was lower than the Biocold unit. Furthermore the Lec unit was cooling to colder temperatures than the Biocold unit.
The Biocold and Lec units both had door sections used for sample storage. In the Biocold unit the air temperatures in these sections were warmer than 10ºC following the timed door openings which may not be a suitable environment for some samples or contents.
This case study was designed around the performance of these models. By this it is meant that their recovery from a door opening was waited for instead of seeing the effects of multiple door openings upon the contents of these units. Therefore, this study may be expanded and developed to include sample probes in all fridge compartments and sections with each unit subjected to a variety of door openings of known durations and frequencies so that the data may more closely reflect the demands placed upon these units by laboratory users. In turn, this would help end users to select the most appropriate fridge based upon their specific requirements.
Acknowledgements
Special thanks to all those who made this study possible in particular:
Professor Liam Grover and Miss Emma Lardner, Healthcare Technologies Institute, University of Birmingham.
Mr Dan Smith, Estates Department, University of Birmingham.
Mr Joshua Chapman, Scientific Laboratory Supplies Ltd.
For further information on this study, or lab sustainability in general please contact Andy Evans, office@greenlightlabs.co.uk.
Digital Edition
International Labmate Buyers' Guide 2024/25
June 2024
Buyers' Guide featuring: Product Listings & Manufacturers Directory Chromatography Articles - Enhancing HPLC Field Service with fast-response, non-invasive flowmeters - Digital transformatio...
View all digital editions


24_06.jpg)


.jpg)
Events
Jul 20 2024 Denver, CO, USA
Jul 21 2024 Cape Town, South Africa
Jul 28 2024 San Diego, CA USA
Jul 30 2024 Jakarta, Indonesia
Jul 31 2024 Chengdu, China