Laboratory Products
These revolutionary new controllers for recording temperatures
Oct 09 2013
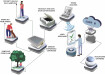
Recording temperatures for use in publications, or simply in order to monitor that a heat treatment process has taken place as required, has never been quite so simple as it has just become for users who specify their new Carbolite furnace or oven with a nanodac™ controller.
These revolutionary new controllers are now available across the full range of Carbolite laboratory furnaces and ovens and provide exceptional new features for those who not only require precision in temperature control but also a permanent record of the temperature cycle made by their furnace or oven.
At its simplest the nanodac™ can be fitted to your oven or furnace as just a paperless chart recorder, or as a basic set-point temperature recorder with added data logging capability. Even in set-point controller format autotune and temperature overshoot inhibition is provided. However, the nanodac™ really comes into its own when specified as the fully fledged programmable-data-logging version.
Navigation is via a 3.5” VGA colour screen and the familiar 4 Eurotherm control buttons. In the programmer configurations up to 100 temperature profile programs, each with up to 25 segments can be stored on board the nanodac™. Meanwhile 50MB of on board Flash memory is available to record and store data in either CSV (comma separated value) or secure UHH (Eurotherm’s proprietary secure storage) format. Once recorded data can be downloaded onto a USB memory stick or via FTP onto a networked server or linked PC.
The recorder has four input channels and so can for example record from additional thermocouples, or process devices as well as from up to 30 virtual channels such; as maths, counter or totaliser functions.
Finally if you are one of those guys who simply can’t leave the work behind or you just want an easy way to find out what your furnace is doing without leaving your desk or getting the IT department to rewire the laboratory the nanodac™ is now able to serve a view of the data-logging in progress to a web browser page. All that is needed is either an Ethernet link to a web server or for local viewing simply a connection to a wireless router.
-(1)-(1).jpg)
Digital Edition
ILM 49.5 July
July 2024
Chromatography Articles - Understanding PFAS: Analysis and Implications Mass Spectrometry & Spectroscopy Articles - MS detection of Alzheimer’s blood-based biomarkers LIMS - Essent...
View all digital editions
24_06.jpg)


Events
Jul 28 2024 San Diego, CA USA
Jul 30 2024 Jakarta, Indonesia
Jul 31 2024 Chengdu, China
ACS National Meeting - Fall 2024
Aug 18 2024 Denver, CO, USA
Aug 25 2024 Copenhagen, Denmark