Laboratory Products
Getting the Most Value from Your Compound Data
Apr 10 2013
Author: Matthew Segall on behalf of Optibrium
In order to mitigate potential risks in drug discovery, data are routinely generated for large numbers of compounds across many properties at great effort and expense. However, much of these data do not have sufficient impact on compound design and selection decisions and too often they are consigned to a database without ever being considered. This unfortunate situation arises because decision-making based on complex, multi-parameter data is challenging. As a result there is a tendency to oversimplify and focus decisions around smaller numbers of better-known properties, discounting potentially valuable information.
This article explores ways in which greater value can be gained from the data generated in drug discovery laboratories. Intuitive multi-parameter optimisation approaches make it easy to include all relevant data in the decision-making process, guiding the selection of compounds with the best balance of properties for a successful drug, while ensuring that each property has an appropriate influence. The article will also illustrate how property data can be easily modelled, thereby capturing and visualising the relationships between chemical structures and their properties, to guide the optimisation of new compounds. If provided in a user-friendly, interactive way, that is accessible to all members of a project team, these approaches improve the efficiency and productivity of the drug discovery process.
Drug discovery is a risky business! The large majority of projects fail and, even for those that nominate a development candidate, only approximately one in twelve result in a drug that reaches the market [1]. This success rate has remained relatively unchanged over the last decade, but the cost per new chemical entity has increased dramatically from an estimated $800M in 2001 [2] to $1,800M in 2010 [1].
There are many causes of project failure, including changes in commercial priorities and lack of efficacy due to unvalidated targets, but a significant proportion are due to inappropriate physicochemical properties, pharmacokinetics (PK) or toxicity [1]. In an effort to address these causes of attrition, a wide range of properties are now routinely monitored in early drug discovery, using predictive models and experimental assays. For example, in the ‘90s, a high level of attrition in the clinic due to poor PK was noted [3], leading to the introduction of approaches for early measurement of absorption, distribution, metabolism and elimination (ADME) properties [4]. The result of this effort has been a reduction in the proportion of compounds failing in the clinic due to PK issues, from an estimated 39% in 1991 [3] to approximately 10% in 2001 [1]. However, the overall success rate in development remained almost constant over the same period [1] [5] because attrition due to toxicity issues has increased commensurately. In reaction to this, there is a current drive to measure more toxicity-related properties earlier in the drug discovery process.
The result of these trends is that many endpoints are now routinely measured for an increasing number of compounds. A successful drug must exhibit a delicate balance of these many properties and the quantity and complexity of these data make them difficult to use effectively.
Understandably, people find it difficult to make good decisions based on complex data, particularly when the data are uncertain and there is significant risk [6]. Therefore, there is a natural tendency to initially focus on a small number of parameters and consider other data later. However, this often means that much of the available data are not given sufficient consideration and their value is lost. Indeed, there are many anecdotes of data being consigned to databases and never actively examined.
This article discusses two approaches to gain more value from all of the data generated in the course of drug discovery projects. The first, multi-parameter optimisation (MPO), enables all of the available compound data to be given appropriate weight in the decision-making process, helping to focus on compounds with the best balance of properties and the highest chance of downstream success [7]. The article will also discuss how compound data, even for compounds that do not progress, can be used to gain information on relationships between compounds’ chemical structures and their properties (known as structure-activity relationships or SARs). These SARs can be used to predict properties of new compounds before synthesis, guiding the design of improved compounds. This allows synthetic and experimental efforts to be focussed on chemistries that are most likely to achieve the required properties.
Multi-Parameter Optimisation
A high quality lead or candidate compound must meet a profile of property criteria including potency against the intended therapeutic target(s), selectivity against potential off-targets, appropriate physicochemical and ADME properties and an absence of toxicity. Unfortunately, these requirements often conflict and finding a perfect compound may be impossible. In addition, the data generated in drug discovery often have significant uncertainty, due to experimental variability or statistical error. Therefore, drug discovery is, in essence, an exercise in achieving a delicate balancing act in the presence of uncertain information.
MPO methods have been developed across many disciplines to address the challenge of simultaneously optimising multiple characteristics and are becoming more widely adopted in drug discovery [8]. An MPO method for drug discovery needs to meet a number of requirements: it must be flexible, because the property criteria for a successful drug will vary widely depending on the therapeutic objective, intended route of administration and many other factors; it must be possible to weight the individual criteria to define acceptable trade-offs because, as discussed above, it may be impossible to satisfy all of the criteria simultaneously; the output should be interpretable to provide guidance to scientists regarding the most critical issues to address in order to further optimise a compound; and it must deal appropriately with uncertainty in the data. The last of these is the largest difference between application of MPO to drug discovery and other fields, where the data typically have lower variability and uncertainty. The goal is to identify the compounds with the best chance of success against the over profile of criteria, but without missing opportunities by inappropriately rejecting compounds based on uncertain data.
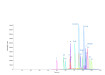
One approach to MPO in drug discovery is Probabilistic Scoring [7], which enables a project team to define the profile of property criteria that an ideal compound would achieve. These criteria can be individually weighted to reflect the impact of failing to achieve the ideal outcome on the overall chance of success. An example of such a profile is shown in Figure 1. The compound data can then be assessed against this overall profile, taking into account uncertainties and any missing data points, to score the compounds according their likelihood of achieving the project’s objective. Furthermore, the uncertainty in the overall score for each compound can be assessed to clearly identify when the data allow compounds to be clearly distinguished or, alternatively, if more data are required to make a confident decision. One visualisation of these results is also illustrated in Figure 1.
The impact of each individual property on a compound’s score can also be identified, highlighting the most critical issues that should be addressed in order to improve a compound’s overall chance of success. One approach to visualise this information is illustrated by the histogram in Figure 1.
Figure 1. This graph shows the compounds in a data set, ordered by their overall scores against a profile of property criteria shown inset. The score for each compound, representing the likelihood of success against the profile, is plotted on the y axis. Error bars indicate the uncertainty in the overall score for each compound due to the uncertainty in the underlying data. In this case it is possible to see that the error bar for the top-scoring compound overlaps with ~15 compounds in the data set, indicating that these cannot be confidently distinguished. The inset histogram shows the contribution of each property to the overall score for a single compound. In the example shown, the most significant issue to address in order to increase the overall score is solubility (the colours of the histogram bars correspond to the key in the profile).
Structure Activity Relationships
So far this article has discussed an approach to use compound data to select the ‘best’ compounds for progression. However, understanding the SARs that connect compounds’ chemical structures with their measured properties can inform the design and selection of new compounds that have not yet been made.
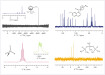
Within a series of compounds with a common ‘scaffold’ or ‘core’ structure, it may be possible to visualise these relationships, as illustrated in the SAR plot in Figure 2. Alternatively, exploring the effects of the same substitutions at similar positions on different scaffolds can identify replacements that have significant impacts on compounds’ properties, so-called ‘activity cliffs’ [9].
More diverse data sets can be analysed using quantitative structure-activity relationship (QSAR) methods that use statistical algorithms to model these effects. A general process for generating QSAR models is illustrated in Figure 3. Typically, a data set is split into two or more subsets. The first of these is used to train models of the SAR by fitting mathematical functions that relate descriptors of simple compound characteristics with the measured values. Common descriptors include whole molecule properties such as molecular weight, volume, charge or lipophilicity, 2-dimensional descriptors such as counts of specific functional group and 3-dimensional shape descriptors. It is essential that statistically trained models are carefully validated to ensure that they are robust and generalise to compounds that are not in the training set. Therefore, a second set of compound data is typically used to compare models based on their ability to make predictions on compounds that are not in the set used to train the models. Finally, if many models are compared against the same validation set, it is possible that one may achieve a good result by chance and therefore it is good practice to retain an external, independent test set to confirm the predictive power of the final model.
Figure 2. Example SAR plot. The substitutions at positions R1 and R2 on the scaffold (inset) are displayed on the vertical and horizontal axes respectively. The size of the circle in each cell shows the number of compounds with the corresponding R1, R2 combination and the colour indicates their average activity from high in yellow to low in red.
Figure 3. Illustration of the process for the automatic generation and validation of QSAR models. The initial data set is split into three separate subsets: training, validation and test. The training set is used to build multiple models using different modelling methods, e.g. partial least squares (PLS), radial basis functions (RBF), Gaussian processes (GPs) and random forests (RF). These models are compared using the validation set to identify the model with the best predictive performance. Finally, the best model is tested against an independent test set to confirm that the model is robust and may be used with confidence for the chemistry of interest. The model may then be easily deployed to make predictions for new compounds of potential interest.
The resulting models can be applied to new compound structures to make predictions of their properties and help to select good compounds. However, when applying a model it is important to ensure that these new compounds lie within the model’s ‘domain of applicability,’ i.e. the chemical space that is well represented by the set of compounds used to train the model. QSAR models are not good at extrapolating to previously unseen chemistry and predictions for compounds that lie outside of the domain of applicability should be treated with caution.
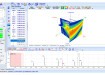
Predictive models can be used interactively to get instant feedback on how properties are likely to change as optimisation strategies are explored. An example of such an interactive designer is shown in Figure 4. However, when a property value is predicted for a new compound, the first questions are often “Why?” and “How can I improve this property?” To help with this, the SAR encoded in a predictive model can be visualised directly on the structure of a compound, as illustrated in Figure 4, to focus redesign efforts on those regions of a compound that are likely to have the biggest impact on improving its properties [10].
Figure 4. The interactive designer in StarDrop with Glowing Molecule™ visualisation. When the compound structure is changed in the editor above, all of the predicted properties on the right update instantly. This provides feedback on the impact of redesign strategies on the overall balance of properties. The colour scale highlighting the compound structure clearly identifies the regions having a strong effect to increase (red) or decrease (blue) the predicted property, helping to understand the SAR and guide the design of compounds with improved properties.
Conclusion
Generating drug discovery compound data is time consuming and expensive and it is important to get the most value from this effort. This article has presented two approaches to use these data to ensure that they influence compound selection decisions and provide information to guide the design of new compounds. These approaches use advanced statistical methods to analyse the data. However, it is no-longer necessary to be an expert computational scientist to use them effectively.
Well designed software can make these available in an intuitive and user-friendly way to build, validate and apply predictive models [11] or to achieve true multi-parameter optimisation [10].
References
1. Paul S, Mytelka D, Dunwiddie D, Persinger C, Munos B, Lindborg S, Schacht A. How to improve R&D productivity: the pharmaceutical industry's grand challenge. Nat. Rev. Drug Discov. 2010;9:203-14.
2. Dimasi J, Hansen R, Grabowski H. The price of innovation: new esitmates of drug development costs. J. Health Econ. 2003;22:151-85.
3. Kennedy T. Managing the drug discovery/development interface. Drug Discov. Today. 1997;2(10):436–444.
4. Tarbit MH, Berman J. High-throughput approaches for evaluating absorption, distribution, metabolism and excretion properties of lead compounds. Curr. Opin. Chem. Biol. 1998;2(3):411-416.
5. Kola I, Landis J. Can the pharmaceutical industry reduce attrition rates. Nature Rev. Drug Discov. 2004;3(8):711-716.
6. Chadwick AT, Segall MD. Overcoming psychological barriers to good discovery decisions. Drug Discov. Today. 2010;15((13/14)):561-569.
7. Segall M, Beresford A, Gola J, Hawksley D, Tarbit M. Focus on Success: Using in silico optimisation to achieve an optimal balance of properties. Expert Opin. Drug Metab. Toxicol. 2006;2:325-337.
8. Segall MD. Multi-Parameter Optimization: Identifying high quality compounds with a balance of properties. Curr. Pharm. Des. 2012;18(9):1292-1310.
9. Hu X, Hu Y, Vogt M, Stumpfe D, Bajorath J. MMP-Cliffs: Systematic Identification of Activity Cliffs on the Basis of Matched Molecular Pairs. J. Chem. Inf. Model. 2012;52(5):1138-1145.
10. Segall M, Champness E, Obrezanova O, Leeding C. Beyond profiling: Using ADMET models to guide decisions. Chem. & Biodiv. 2009;6(11):2144-2151.
11. Obrezanova O, Gola JMR, Champness E, Segall MD. Automatic QSAR modeling of ADME properties: blood-brain barrier penetration and aqueous solubility. J Comp Aid Mol Design. 2008;33:431-440.
Digital Edition
International Labmate 49.6 - Sept 2024
September 2024
Chromatography Articles - HPLC gradient validation using non-invasive flowmeters Mass Spectrometry & Spectroscopy Articles - From R&D to QC, making NMR accessible for everyone: Putting NMR...
View all digital editions


Events
Oct 06 2024 Liverpool, UK
Oct 08 2024 Gothenburg, Sweden
Oct 09 2024 Birmingham, UK
Oct 09 2024 NEC, Birmingham, UK
Oct 15 2024 Milan, Italy