-

-
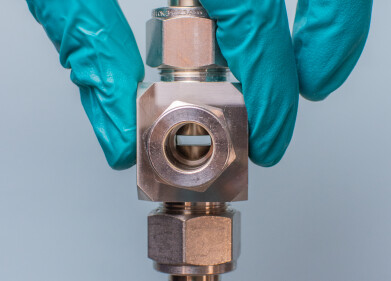
 The Pearl Liquid Transmission Accessory with an Oyster Cell.
 -
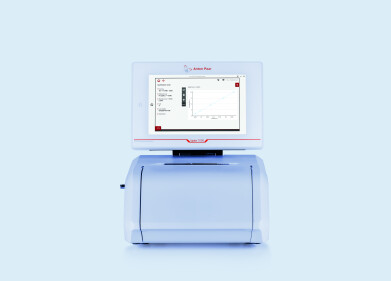
 The Pearl Liquid Transmission Accessory.
 -

-

Mass Spectrometry & Spectroscopy
Analysing the Highs and Lows of Cannabis Derivatives with FTIR
Mar 04 2021
A wide variety of cannabis derived products are now available for purchase, although the legality of these products varies from country to country. Within Europe, products containing more than 0.2% tetrahydrocannabinol (THC) are banned, however cannabidiol (CBD) containing products are legal. This note compares the FTIR spectra obtained from two such legal products.
Method
Two commercially available Cannabidiol (CBD) food supplements were obtained. One was specified as 5% CBD, whilst the other contained 2.75% CBD. The ingredients list for both products contained Hemp seed oil and Hemp paste, whilst the lower strength product also contained sunflower lecithin. The two samples were placed in a 25 µm wedged CaF2 oyster cell and spectra of the samples recorded on a commercially available spectrometer.
Results and Discussion


Figure 1 shows the spectra recorded for the two oils. As expected, the two traces are very similar with small changes corresponding to the differences in the chemical compounds present within the two products. To more easily interrogate the differences between the products, a difference spectrum was obtained (Figure 2), where the 2.75% spectrum was subtracted from the 5% one. In a difference spectrum, positive peaks indicate a higher concentration of absorbing species in the 5% oil than in the 2.75% oil, while negative peaks indicate a lower or zero concentration.


Also shown are spectral traces for pure CBD (red) and linoleic acid (the major component of sunflower lecithin, green). By comparing these spectra to the difference spectrum, it is immediately apparent that the positive peaks in the difference spectrum (highlighted with red arrows) correspond to an increase of CBD, whilst the negative peak (highlighted with a green arrow) corresponds to the C=O stretch from linoleic acid. By comparing the traces shown in Figure 1 this band is present as a shoulder only in the 2.75% trace, whilst the 5% oil does not exhibit this shoulder since it does not contain the sunflower lecithin ingredient.
This shoulder is present on the edge of multiple overlapping intense bands at ca. 1740 – 1750 cm-1 that are present in both supplements (albeit in greater quantities in the 5% supplement than the 2.75% supplement as indicated by a positive peak in the difference spectrum). These peaks do not arise from the CBD oil since these peaks are not present in the red trace shown in Figure 2. Based on their location in the IR spectrum, they can be tentatively assigned to fatty acid ester present in the hemp oil.


CBD has two peaks at 1628 and 1586 cm-1 that can be assigned to a C=C stretch. These peaks are easily identifiable in both traces shown in Figure 1 (confirming the presence of CBD in both products) and would provide ideal candidates for quantification; by preparing known calibration standards and recording the peak intensity of these two peaks the exact percentage of CBD oil in each batch could be rapidly determined. The Pearl and Oyster system is optimised for high throughput and would be ideally suited for this kind of application.

Summary


In conclusion, these results confirm that the 5% CBD oil does indeed contain more CBD than the 2.75% oil, whilst also confirming the presence of sunflower lecithin in the 2.75% oil and absence of this ingredient in the 5% oil.
Specac have many other application notes that show off their Pearl Liquid Transmission Accessory that you can find on the website www.specac.com. The company are always looking for more so why not get in touch.
Digital Edition
Lab Asia 31.6 Dec 2024
December 2024
Chromatography Articles - Sustainable chromatography: Embracing software for greener methods Mass Spectrometry & Spectroscopy Articles - Solving industry challenges for phosphorus containi...
View all digital editions
Events
Jan 22 2025 Tokyo, Japan
Jan 22 2025 Birmingham, UK
Jan 25 2025 San Diego, CA, USA
Jan 27 2025 Dubai, UAE
Jan 29 2025 Tokyo, Japan


