Laboratory Products
Five Ways to Improve Accuracy of 1 μL UV-Vis Quantification
Nov 01 2017
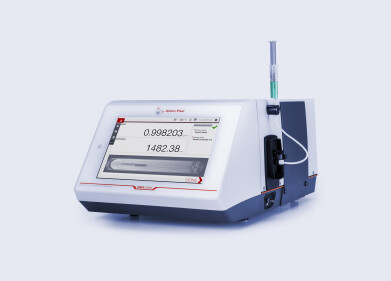
Understanding best practice for preparing and measuring your samples when using microvolume spectrophotometers will avoid sources of error that affect the accuracy of quantification results. Below are 5 key ways to ensure measurement accuracy and how DeNovix DS-11 Series spectrophotometers oversee the sample QC process.
1. The importance of sample preparation
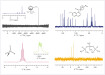
Ensure that sample isolation protocols are optimized and that the samples are purified prior to measurement. Keep in mind that a UV-Vis spec does not discriminate between the sample of interest and contaminants that also absorb at the same wavelength. All nucleic acids exhibit a peak at or around 260 nm including degraded or single stranded DNA in a double stranded DNA sample solution.
Monitoring 260/280 and 260/230 purity ratios will provide an insight into sample contamination. The DS-11 SmartQC™ feature will automatically flag samples purity ratios are outside threshold values.
2. Sample surface cleaning
Ensuring that both top and bottom measurement surfaces are clean prior to loading blanks or samples is important to avoid problems with subsequent readings. Performing a blank measurement on a dirty sampling surface (either top or bottom) will result in erroneous absorbance values such as negative spectra or sample concentrations being calculated as lower than the actual values. SmartQC will alert users when a previous sample has not been removed.
3. Blank measurements and buffers
An appropriate blank is a prerequisite for
accurate concentration measurement. Use the
same buffer as the sample is suspended in for the
blank reading and ensure that the measurement
surfaces are clean prior to loading. SmartQC performs a spectral analysis, alerting users to potential issues with blanks.
4. Measure samples within the limits of detection the spectrophotometer
All spectrophotometers have a lowest quantity of analyte that can be distinguished from the background noise. A tolerance specification may be given as either a percentage or a concentration for a specific analyte. For example, where the tolerance specification is 2 ng/μL for dsDNA, a sample with a concentration of 4 ng/μL could range from 2 to 6 ng/μL. The DeNovix DS-11 Series has an industry-leading lower detection limit for dsDNA of 0.75 ng/μL.
When working with samples at or near the lower detection limit for absorbance, fluorescence methods enhance the sensitivity of quantification. The lower limit of detection for fluorescence using the DS-11 Series is 0.0005 ng/µL.
5. Routine best practices
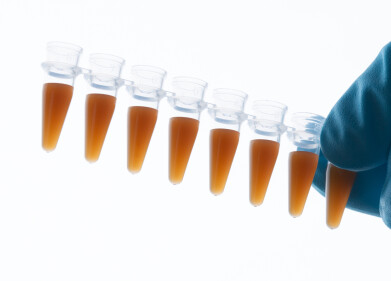
- Ensure that the sample solutions are homogeneous by vortexing prior to measuring.
- Visually confirm the aliquot has been delivered to the measurement surface. Protein samples may wick to the outside of the tip and may not be properly dispensed. 

- Use a fresh tip for each sample and always use a fresh aliquot for any replicates. 

- Use a dry lab wipe to remove the sample from both the top and the bottom surface immediately after each measurement.
For more information and additional technical resources please click here.
Digital Edition
International Labmate 49.6 - Sept 2024
September 2024
Chromatography Articles - HPLC gradient validation using non-invasive flowmeters Mass Spectrometry & Spectroscopy Articles - From R&D to QC, making NMR accessible for everyone: Putting NMR...
View all digital editions


.jpg)


Events
Oct 15 2024 Milan, Italy
Oct 17 2024 Dhaka, Bangladesh
Oct 20 2024 Fort Worth, TX, USA
Oct 21 2024 Dalian, China
Oct 30 2024 Birmingham, UK